For corporate universities and workforce development programs
Can your learners do it on their own?
That is the question an employer asks the day after a course ends. XLNC helps you answer it by measuring each person on one ruler with an error bar. Then we grow them in the flow of work, one step above where they stand today.
By learning and development we mean all of it: formal training, coaching, performance support tools people use on the job, and the practice built into everyday work. Each one is judged the same way, by whether people can then do the work on their own.
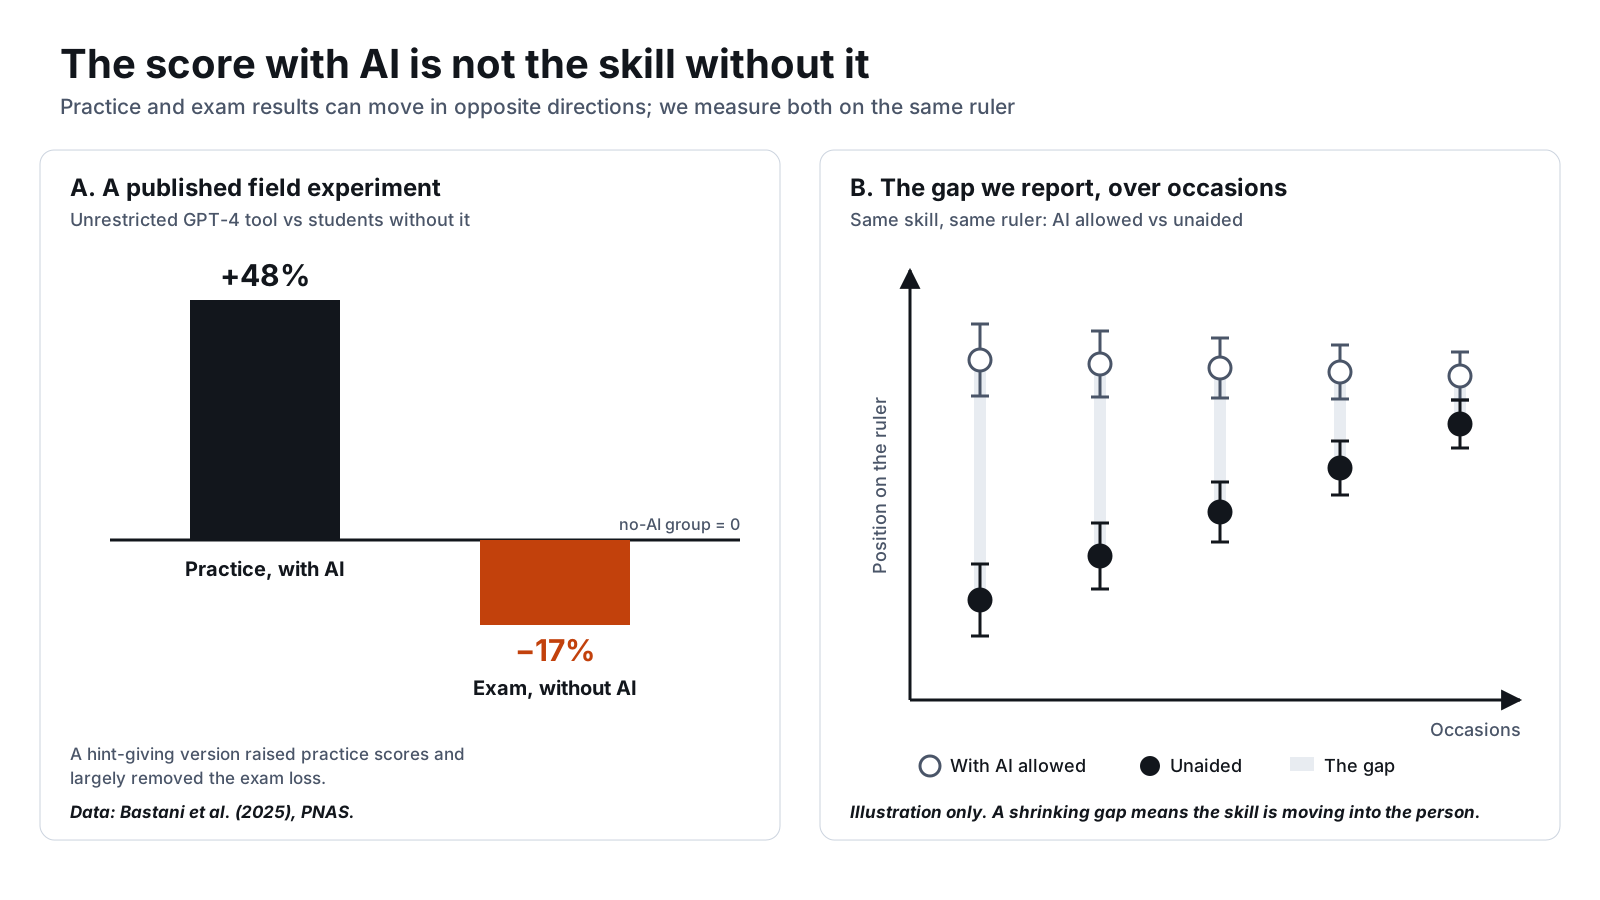
AI tools make the question harder to answer, because a polished answer no longer shows who did the thinking. In a field experiment with about 1,000 high school math students, those who practiced with an unrestricted GPT-4 chat tool scored 48 percent higher on practice problems. On the later exam, taken without AI, they scored 17 percent lower than students who never had it. A tutor version that gave hints, not answers, raised practice scores by 127 percent and largely removed the exam loss (Bastani et al., 2025).
AI did not decide the outcome. The design around it did. Herman Aguinis makes the same point about teaching: good teaching in the age of AI needs what it always needed, namely shared ownership of the outcome, honest attention to who is actually served, methods with evidence behind them, and explicit redesign rather than assumption (Aguinis, 2026). The rest of this page shows how we build learning and development, and where each idea comes from.
1. One ruler for growth
We place work on the Model of Hierarchical Complexity, developed by Michael Commons and colleagues (Commons et al., 1998; Commons, 2008). It orders tasks by how many ideas a person must coordinate at once. The stages most relevant at work include Concrete (stage 8), Abstract (9), Formal (11), Systematic (12) and Metasystematic (13). Each stage builds on and organizes the one below it, so growth has a direction.
Because the ruler is about the task, not the person, it works for people and AI systems alike. A learner, a manager and an AI tool can all be placed on it and compared.
2. Two ways to measure: what people can do, and what they usually do
Industrial-organizational psychology separates maximal performance, what a person can do when they know it counts and try their hardest, from typical performance, what they do day to day (Sackett et al., 1988). Learning programs need both. We measure them two ways.
- Maximal: a short adaptive test. Computerized adaptive testing picks each question from the answers so far and stops once the score is precise enough (Weiss, 1982; Wainer et al., 2000). The learner knows it is a test and works unaided.
- Typical: scoring the work itself. We score the work people already produce, as they produce it. We call this Inverted CAT: the work is fixed, and calibrated AI judges are chosen to score it. Matt Barney described the idea in 2010 (Barney, 2010). Nobody stops to sit a test.
Measuring the same skill with AI allowed and on short unaided occasions, on one ruler, shows how much of the work is the person's own. The gap comes with its own error bar. A shrinking gap means the skill is moving into the person.
3. The next step for each person: the Goldilocks zone
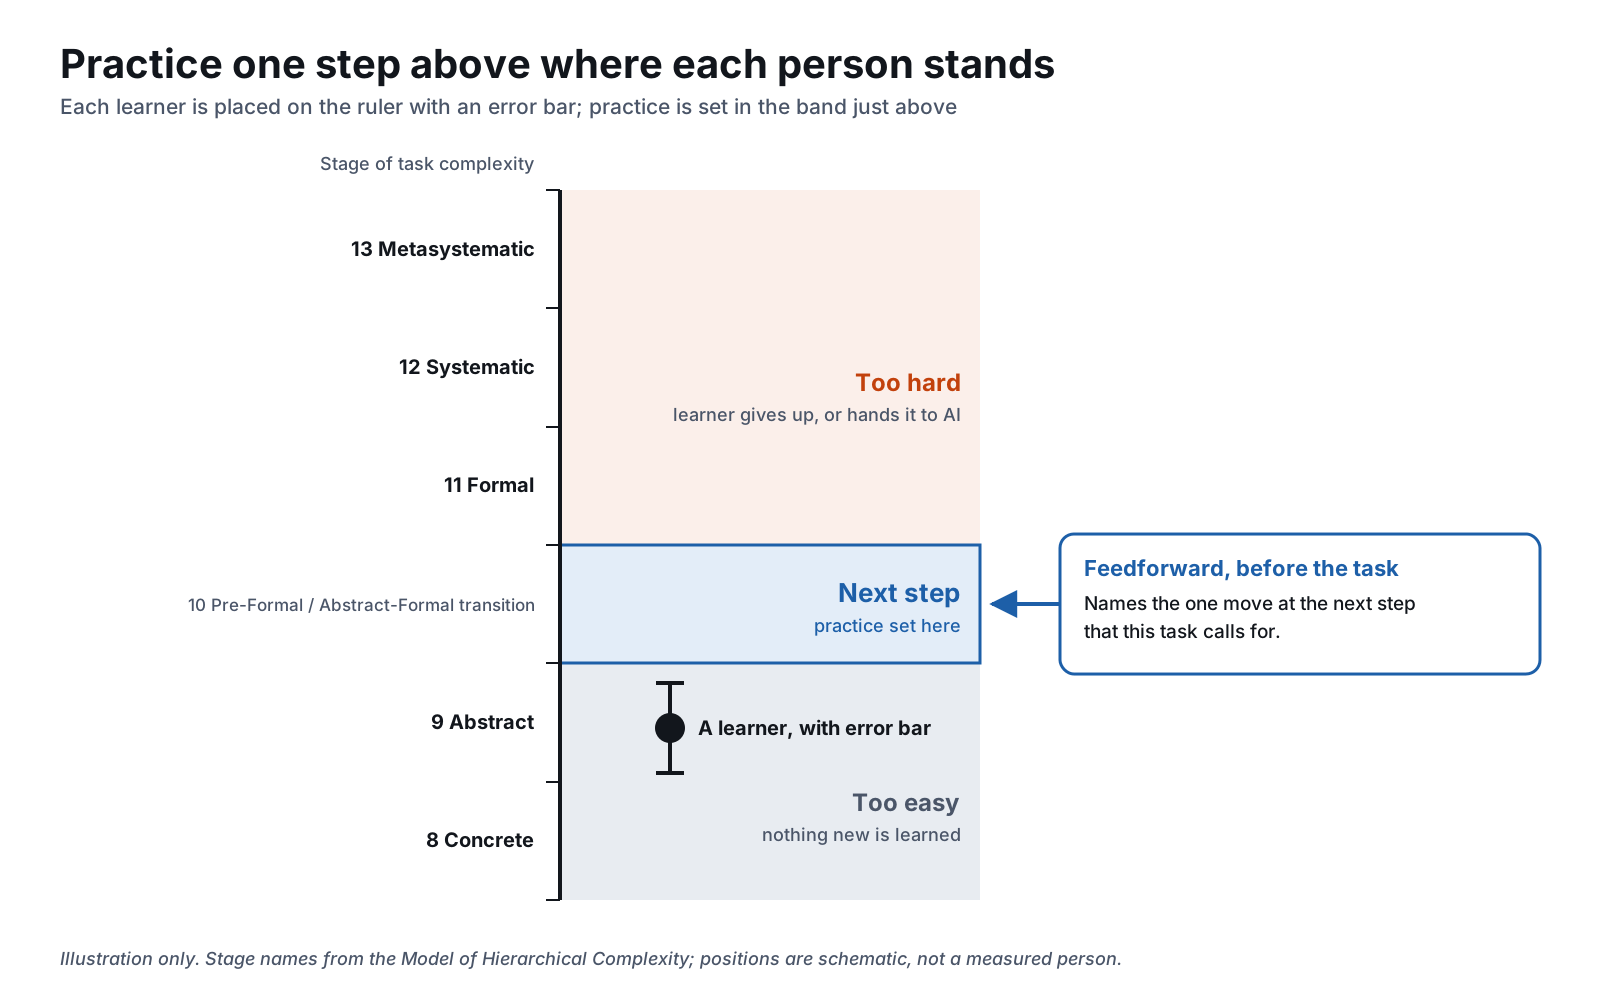
People grow fastest on work just above what they can do alone, with the right help. Lev Vygotsky called this the zone of proximal development (Vygotsky, 1978). Too easy and nothing is learned. Too hard and the learner gives up, or hands the task to an AI tool.
Because each person is placed on the ruler with an error bar, we can set practice one step above where they stand. That is mass personalization: every learner in their own Goldilocks zone, not the class average.
4. Practice that builds the skill
Experts are built by deliberate practice: focused work on tasks just beyond current ability, with feedback, repeated over time (Ericsson et al., 1993). Time spent is not enough. The practice has to target the gap.
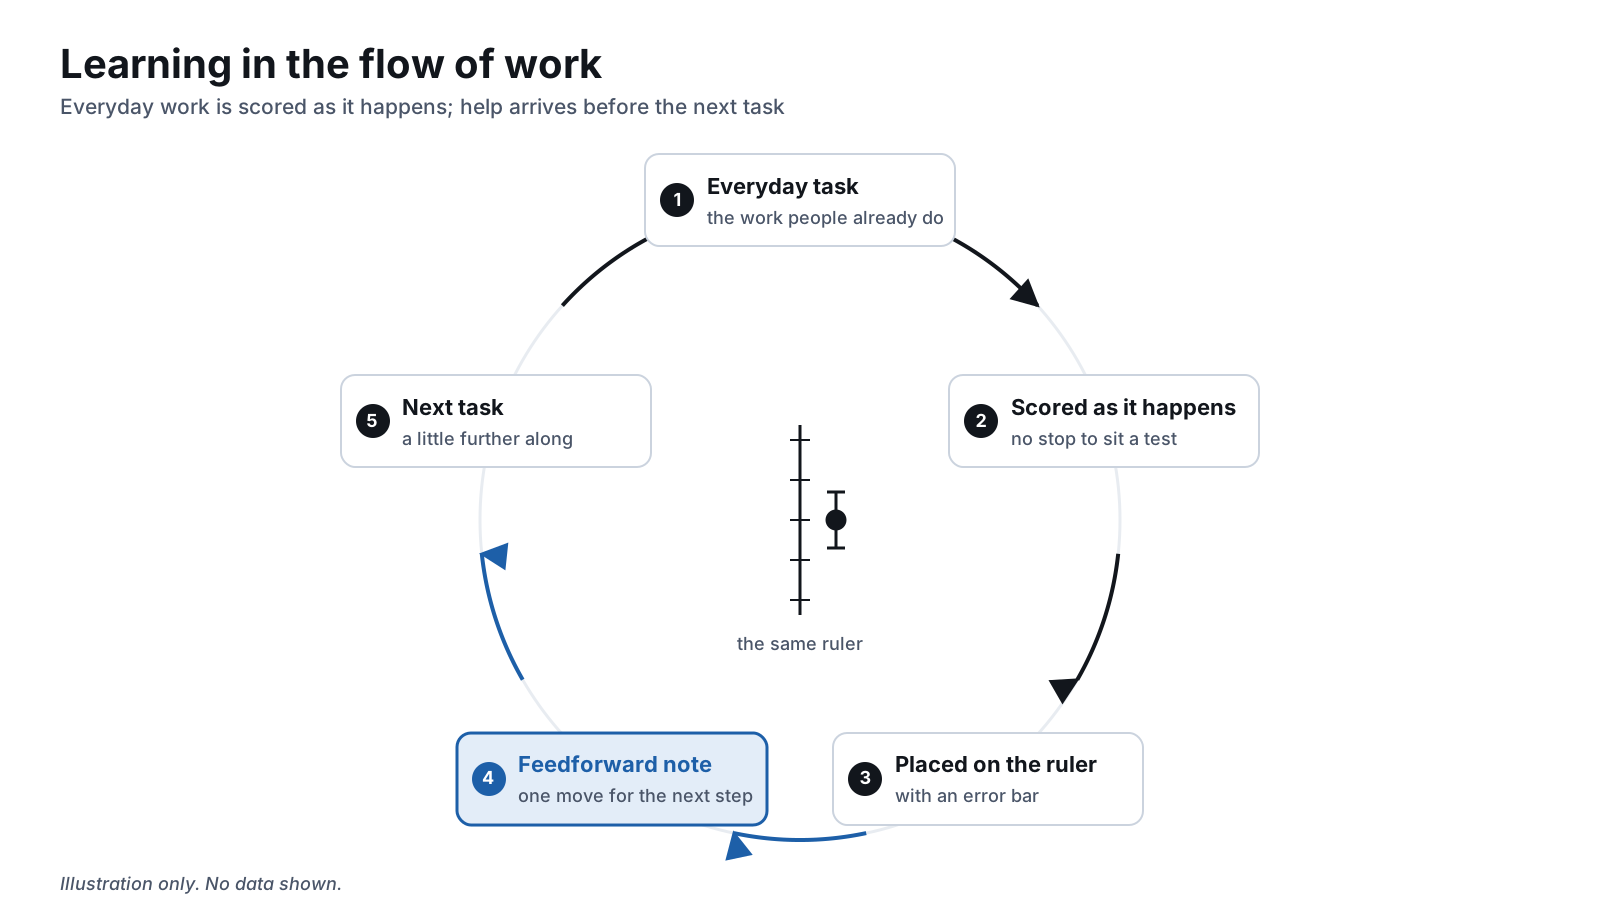
Our measurements tell each learner which gap to target. Because the practice happens on real work, it is learning in the flow of work, not time away from it.
5. Feedforward, just in time
Feedback does not always help. A large review of feedback studies found that in more than a third of cases, feedback made performance worse (Kluger & DeNisi, 1996). Avraham Kluger and Dina Nir's feedforward interview takes a different route: it asks people about times they were at their best, then carries those conditions forward into the work ahead (Kluger & Nir, 2010).
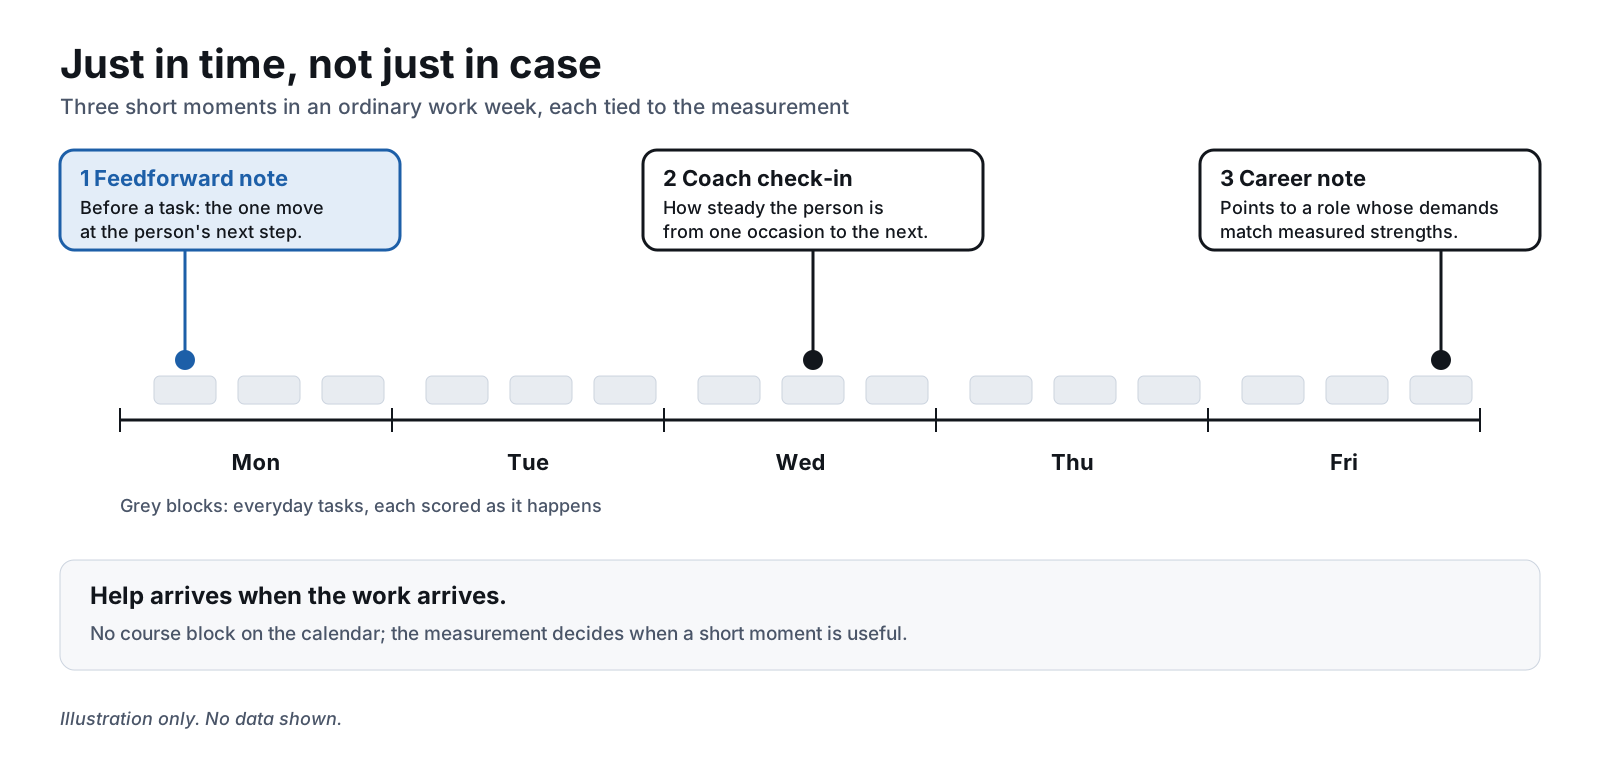
We send a short feedforward note before a task, not after it. It names the one move at the learner's next step that this task calls for. Help arrives when the work arrives: just in time, not just in case.
6. Training, coaching and performance support as scaffolding
Kurt Fischer's skill theory shows that people perform at a higher level with support than without it. He called the unsupported level functional and the supported level optimal; the space between them is where development happens (Fischer, 1980; Fischer & Bidell, 2006).
We treat training, coaching and performance support tools as that support, and we measure both levels. Coaches and managers see where a person stands, how steady they are from one occasion to the next, and which roles their measured strengths point toward. That makes coaching support both performance today and the next career move. As the person grows, the support is withdrawn step by step, and the unaided score shows whether the skill stayed.
7. Why it matters to the business
Barney's Cue See Model describes value as a flow that can be managed on four targets: quality, cost, quantity and cycle time (Barney, 2013). Talent is part of that flow. A development program should deliver people who can do the work well (quality), at a sensible cost per capable person (cost), in the numbers the business needs (quantity), and fast enough to matter (cycle time).
Each target is a risk when it is guessed. Measurement on one ruler, with error bars, replaces the guess: you see how many people cleared the standard, how fast they got there, and what it cost, and you can stop programs that do not move the ruler.
This is our design. We have not yet published learning outcomes from it, and the exam figures above come from a school study, not a workplace.
Talk to us about a development program AI transformation and Human-ARROW
8. From AI literacy to Organizational Digital Twins
Industry 5.0 asks for industry that is human-centric, sustainable and resilient (Breque et al., 2021). For a workforce, that means growing people from using AI tools well to redesigning how the whole organization works. We map that path as one progression on the same ruler: AI literacy, then AI-enabled process improvement, then process transformation, and at the top, building Organizational Digital Twins.
The figure is a construct map in the style of Mark Wilson (Wilson, 2005) and William Fisher's work on rulers that stay the same across people and settings (Fisher, 2009). People sit on one side, example tasks on the other. Each learner gets an error bar, and the step just above it is that person's Goldilocks zone.
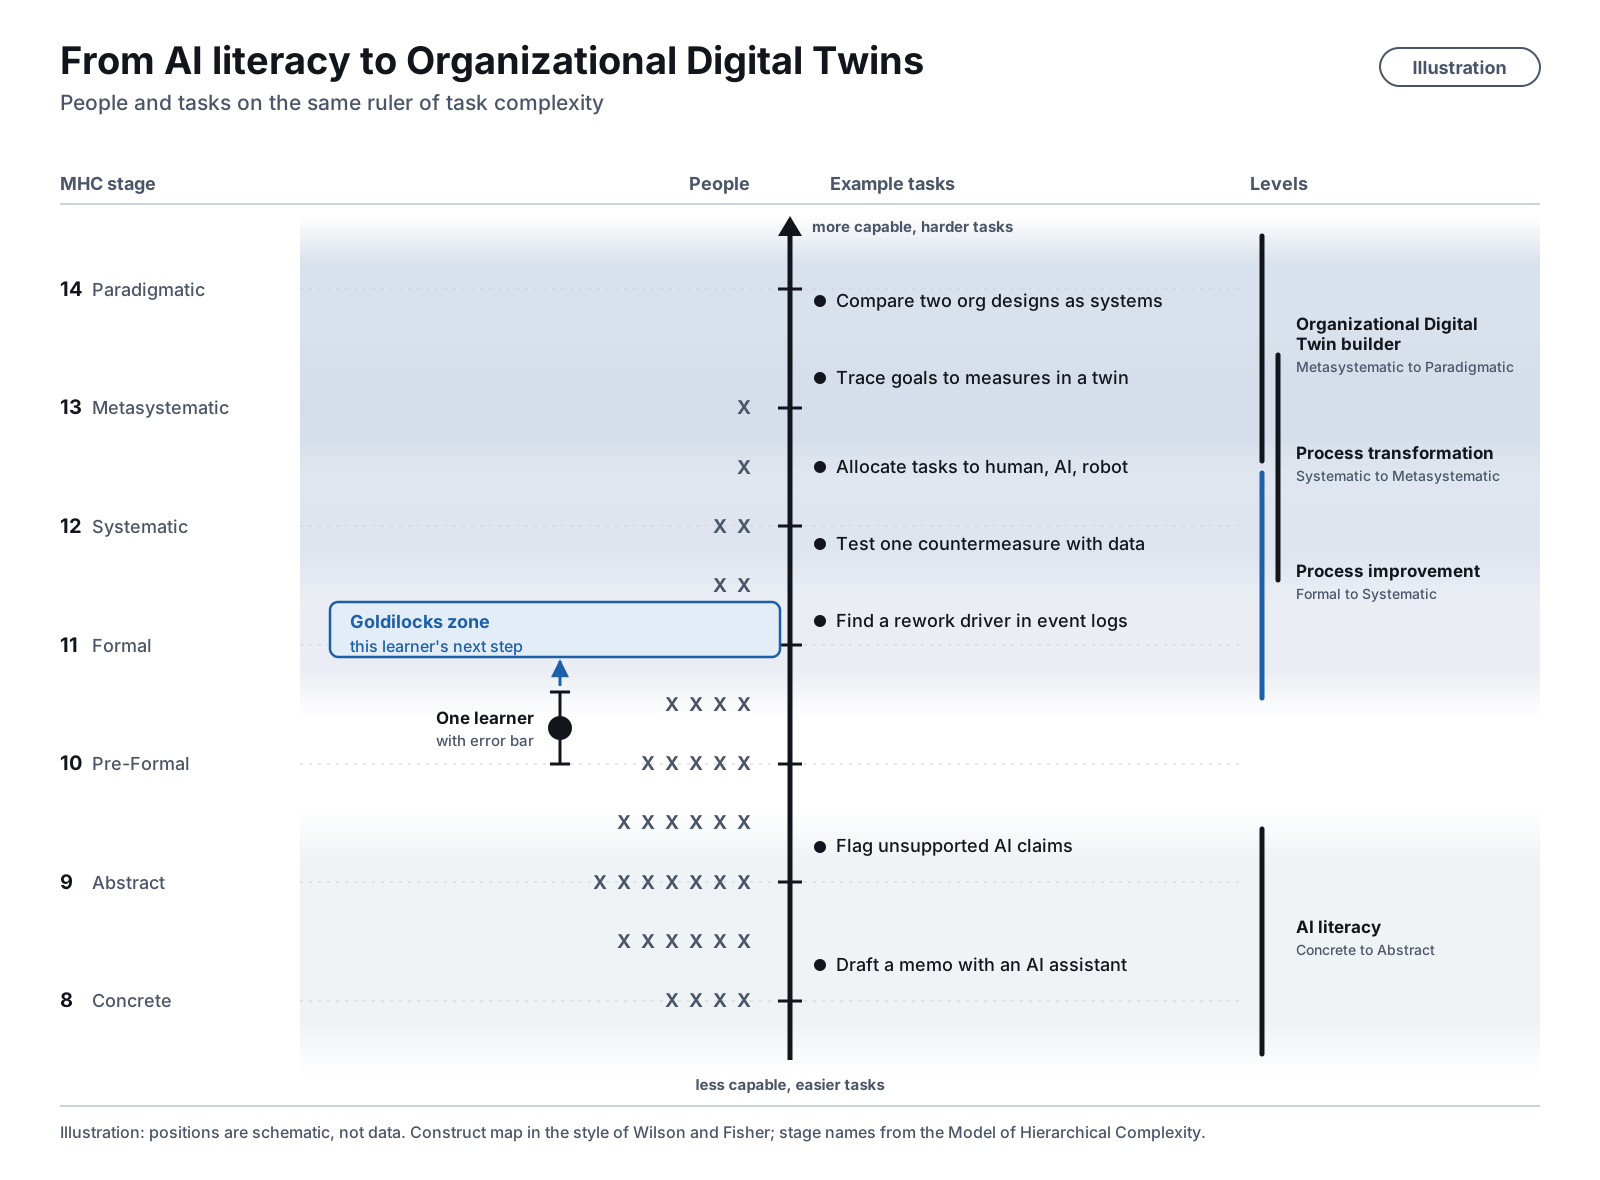
Illustration. This progression is a proposal; it has not yet been calibrated on people.
References
- Aguinis, H. (2026, September 24). Teaching in the age of AI [Article]. LinkedIn. https://www.linkedin.com/pulse/teaching-age-ai-herman-aguinis-kdl4e/
- Barney, M. (2010). Inverted computer-adaptive Rasch measurement: Prospects for virtual and actual reality [Conference presentation]. First Conference of the International Association for Computerized Adaptive Testing, Arnhem, Netherlands.
- Barney, M. (2013). Leading value creation: Organizational science, bioinspiration, and the cue see model. Palgrave Macmillan. https://doi.org/10.1057/9781137361509
- Bastani, H., Bastani, O., Sungu, A., Ge, H., Kabakcı, Ö., & Mariman, R. (2025). Generative AI without guardrails can harm learning: Evidence from high school mathematics. Proceedings of the National Academy of Sciences, 122(26), e2422633122. https://doi.org/10.1073/pnas.2422633122
- Breque, M., De Nul, L., & Petridis, A. (2021). Industry 5.0: Towards a sustainable, human-centric and resilient European industry. European Commission, Directorate-General for Research and Innovation. https://doi.org/10.2777/308407
- Commons, M. L. (2008). Introduction to the model of hierarchical complexity and its relationship to postformal action. World Futures, 64(5–7), 305–320. https://doi.org/10.1080/02604020802301105
- Commons, M. L., Trudeau, E. J., Stein, S. A., Richards, F. A., & Krause, S. R. (1998). Hierarchical complexity of tasks shows the existence of developmental stages. Developmental Review, 18(3), 237–278. https://doi.org/10.1006/drev.1998.0467
- Ericsson, K. A., Krampe, R. T., & Tesch-Römer, C. (1993). The role of deliberate practice in the acquisition of expert performance. Psychological Review, 100(3), 363–406. https://doi.org/10.1037/0033-295X.100.3.363
- Fischer, K. W. (1980). A theory of cognitive development: The control and construction of hierarchies of skills. Psychological Review, 87(6), 477–531. https://doi.org/10.1037/0033-295X.87.6.477
- Fischer, K. W., & Bidell, T. R. (2006). Dynamic development of action and thought. In W. Damon & R. M. Lerner (Eds.), Handbook of child psychology: Vol. 1. Theoretical models of human development (6th ed., pp. 313–399). Wiley. https://doi.org/10.1002/9780470147658.chpsy0107
- Fisher, W. P., Jr. (2009). Invariance and traceability for measures of human, social, and natural capital: Theory and application. Measurement, 42(9), 1278–1287. https://doi.org/10.1016/j.measurement.2009.03.014
- Kluger, A. N., & DeNisi, A. (1996). The effects of feedback interventions on performance: A historical review, a meta-analysis, and a preliminary feedback intervention theory. Psychological Bulletin, 119(2), 254–284. https://doi.org/10.1037/0033-2909.119.2.254
- Kluger, A. N., & Nir, D. (2010). The feedforward interview. Human Resource Management Review, 20(3), 235–246. https://doi.org/10.1016/j.hrmr.2009.08.002
- Sackett, P. R., Zedeck, S., & Fogli, L. (1988). Relations between measures of typical and maximum job performance. Journal of Applied Psychology, 73(3), 482–486. https://doi.org/10.1037/0021-9010.73.3.482
- Vygotsky, L. S. (1978). Mind in society: The development of higher psychological processes. Harvard University Press. ISBN 978-0-674-57629-2
- Wainer, H., Dorans, N. J., Eignor, D., Flaugher, R., Green, B. F., Mislevy, R. J., Steinberg, L., & Thissen, D. (2000). Computerized adaptive testing: A primer (2nd ed.). Lawrence Erlbaum Associates. https://doi.org/10.4324/9781410605931
- Weiss, D. J. (1982). Improving measurement quality and efficiency with adaptive testing. Applied Psychological Measurement, 6(4), 473–492. https://doi.org/10.1177/014662168200600408
- Wilson, M. (2005). Constructing measures: An item response modeling approach. Lawrence Erlbaum Associates. https://doi.org/10.4324/9781410611697