Your tools ask the questions and run the gates. We make the number they produce mean the same thing every time, with its error bar printed beside it.
2026-10-02 · measurement
A release ships, a vendor is renewed, a model is promoted. Each decision rests on a score that looked confident. The cost arrives later, when the score turns out to have been wider than anyone could see.
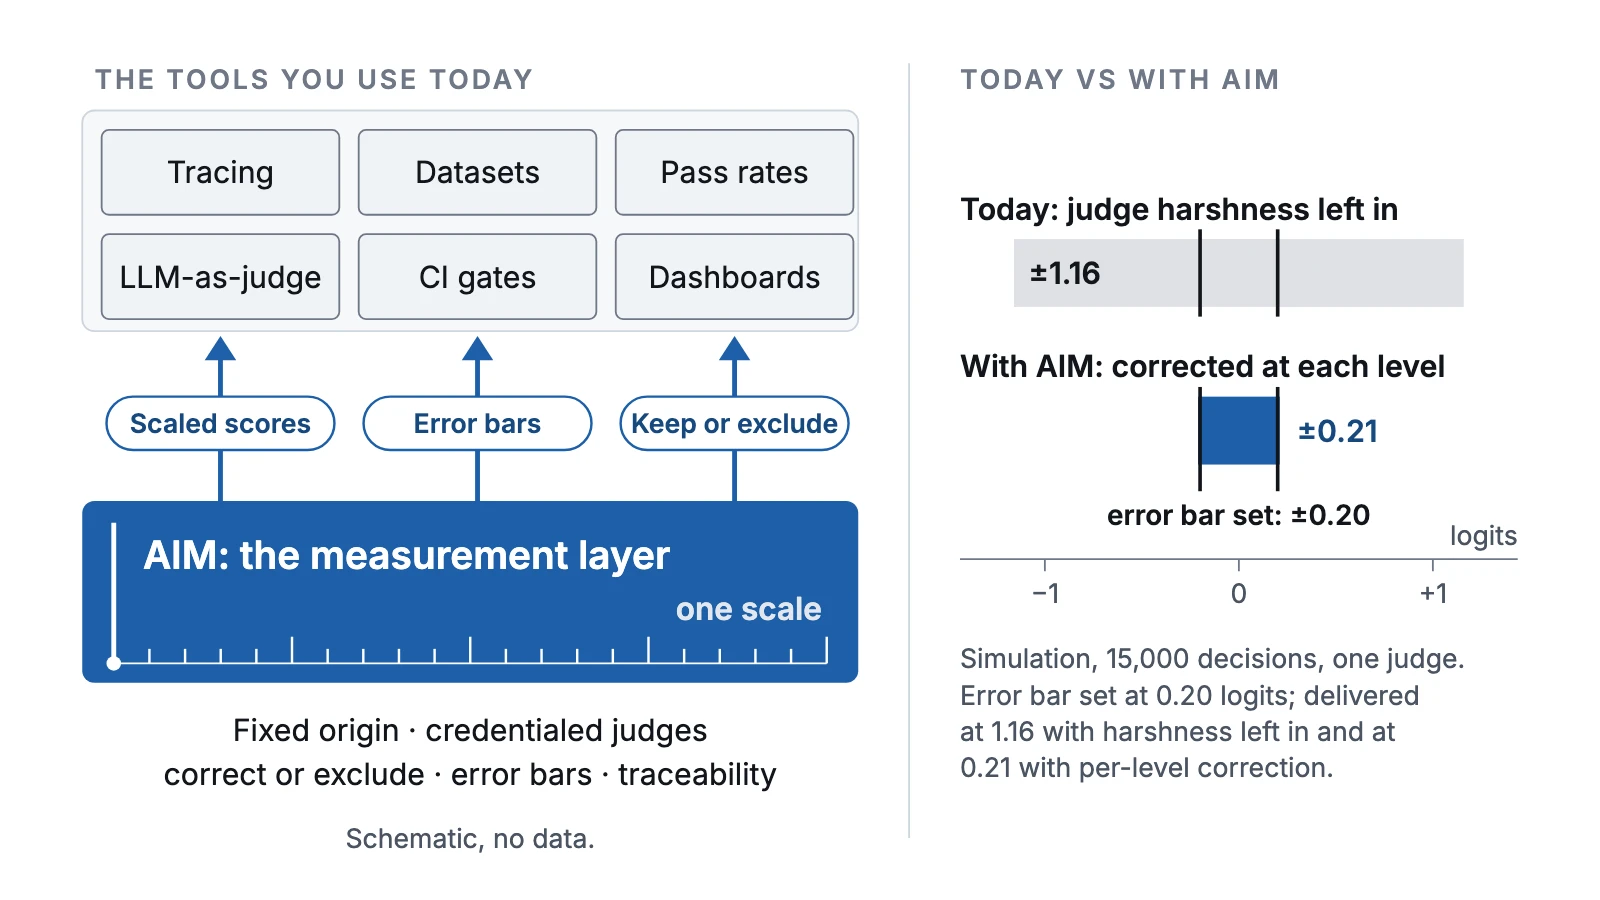
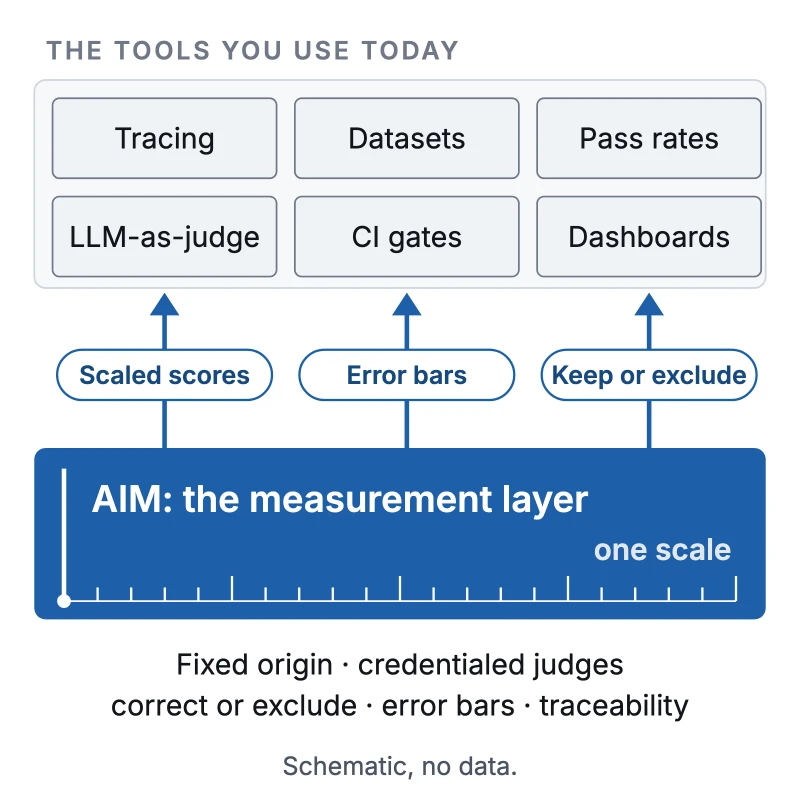
AIM does not replace the tools that produced that score. It sits underneath them and supplies the one thing they assume and none of them provides: a calibrated ruler, so every score carries a known error bar, lands on one scale, and has a record behind it.
If you stop reading here, hold two things. Your tools stay. The number underneath them needs a ruler.
Your stack is good at its job. Tracing captures every call, prompt and tool step. Dataset tools curate and version your test sets. Pass-rates count what passed. AI judges score open-ended output at a volume no human team could match. CI gates block regressions, and dashboards catch the trend you would have missed.
None of that needs to change, and nothing below argues that it should.
Ask any of those tools two questions about a score. How wide is the error bar on this number? And what scale is it on, so I can compare it to last quarter's, or to a different model's?
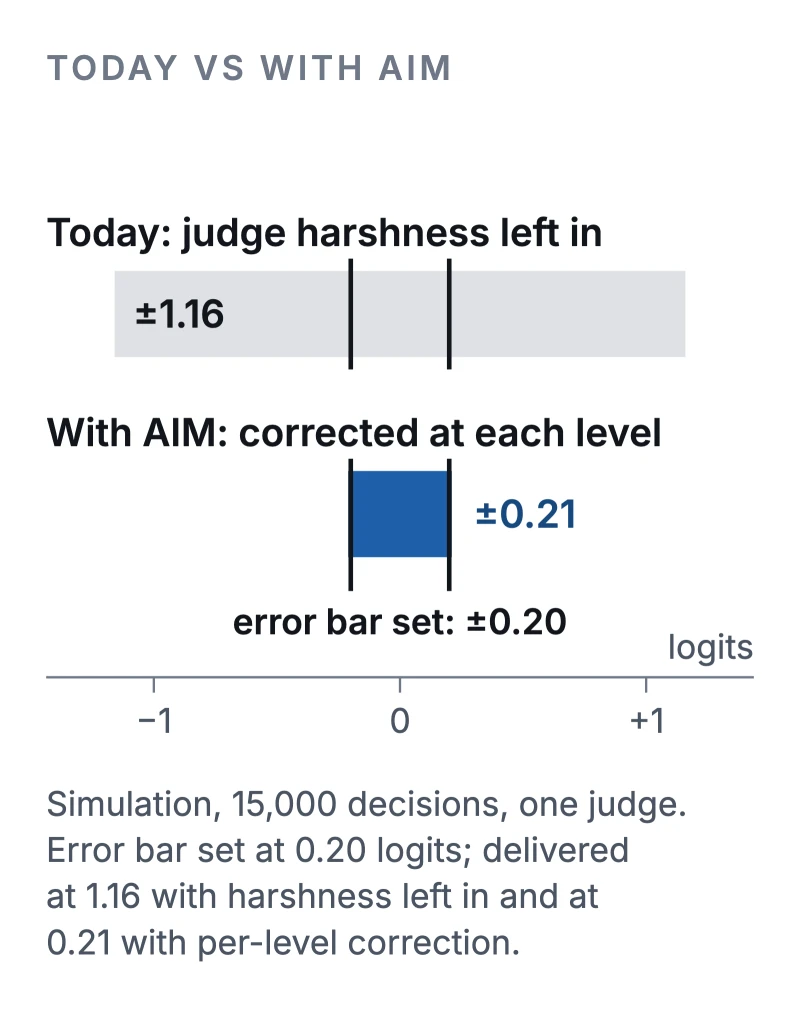
The trace cannot tell you. Neither can the dataset, the pass-rate or the dashboard. Each one works as designed, and the error bar on the number can still be about six times wider than its label.
We ran the same 15,000 certification decisions three ways, on the same responses, with one AI judge. The measurement was set to an error bar of 0.20 logits.
Simulation. One judge, 13 to 35 responses per cell. Results are model output, not field measurements. The correction was estimated in-sample. Multi-judge generalization is a separate, gated study.
The full method and all three treatments are in the whitepaper.
| What your eval and observability tools do (and keep doing) | What AIM supplies beneath them |
|---|---|
| Tracing: capture every call, prompt, tool step and output | A calibrated ruler: one interval scale with a fixed origin, so a step means the same at the bottom and the top |
| Datasets: curate, version and slice test sets | Frozen, fingerprinted question sets, so a move reads as a move in the model, not in the test |
| Pass-rates and metrics: count what passed | An error bar on every score, so "better" means better by more than the noise |
| LLM-as-judge: score open-ended output at scale | Judges used only at the levels of work where they were measured and admitted; steady harshness corrected, uncorrectable distortions excluded and recorded |
| CI gates: block a change that regresses | A gate that knows its own noise: pass when the improvement exceeds its error bar, hold when it does not |
| Dashboards and alerts: watch trends | One scale across models and versions; human experts join it after a calibration study that comes next |
| Root-cause views: which segment moved the metric | Which construct moved |
| (scores as they come) | Traceability: any decision traces to the question, bank version, scoring rule, judge and correction applied |
The root-cause row changes what a regression costs you. A blended score that drops tells you something got worse. It does not tell you what. AIM measures one construct per instrument, so when a regression lands, it names the capability that dropped. Your team then debugs one thing instead of guessing across the blend.
Before release, certify a model, prompt or agent against the limits you set, with the error bar printed beside the result. In CI, gate on the measure rather than the raw score. In production, re-measure on a locked ruler at a set interval.
AIM reads the exports your tools already produce. Adapters for common eval-framework exports and generic CSV ship today; trace-file input is in build. Measures come back through a REST API, a Model Context Protocol server, or a harness that runs inside your boundary with your own model endpoints. The harness is in build.
Read the whitepaper: the full method, the three-way comparison, and every limit.
Or send us the judge you trust least, and we will show you where it bends.
Calibrated, traceable measurement for decisions that have to survive scrutiny.
Founding cohort: priority access, and a seat to shape the instrument. Email is enough.